


- Save up to 50% on 2026 holidays & tours with Travelbag
- Book selected stays in popular destinations around the world
- Travel before 31st December 2026 (inclusive)
British Virgin Islands weather by month
Check out the British Virgin Islands weather averages by month. Compare detailed monthly climate statistics including temperature, rainfall and sunshine figures.
| Jan | Feb | Mar | Apr | May | Jun | Jul | Aug | Sep | Oct | Nov | Dec | |
|---|---|---|---|---|---|---|---|---|---|---|---|---|
| Maximum daytime temperature °C |  28 28 |
28 |
28 |
29 |
29 |
 30 30 |
30 |
31 |
31 |
30 |
29 |
28 |
| Hours of sunshine (daily) | ||||||||||||
| Days with some rainfall |  19 19 |
 15 15 |
14 |
13 |
 16 16 |
15 |
18 |
20 |
19 |
19 |
20 |
21 |
| Sea temperature °C |  26 26 |
26 |
26 |
26 |
27 |
 28 28 |
28 |
28 |
29 |
29 |
28 |
27 |
More about the British Virgin Islands
British Virgin Islands by month
Jan Feb Mar Apr May Jun Jul Aug Sep Oct Nov Dec
Recommended for the British Virgin Islands
Expires at 23:59 on Tuesday 31st Mar 2026 · View all Travelbag offers
The climate guide for British Virgin Islands (Tortola) shows long term monthly weather averages processed from data supplied by CRU (University of East Anglia), the Met Office & the Netherlands Meteorological Institute. Find out more about our data sources.
Top British Virgin Islands destinations
Below are average maximum temperatures at popular countries, regions and places in the British Virgin Islands for next month - April. Select a destination to see the climate guide for all months of the year.
All British Virgin Islands destinations
Metric (°C / mm) | Imperial (°F / inches)
British Virgin Islands climate overview
The Dutch and Spanish had previously settled this collection of volcanic islands in the Caribbean, before it became a British Territory in the late seventeenth century.
Today the British Virgin Islands, which lie about 80 kilometres (50 miles) to the east of Puerto Rico, govern their own internal affairs while remaining a British dependency. The economy relies mainly on the financial services industry, and on tourism.
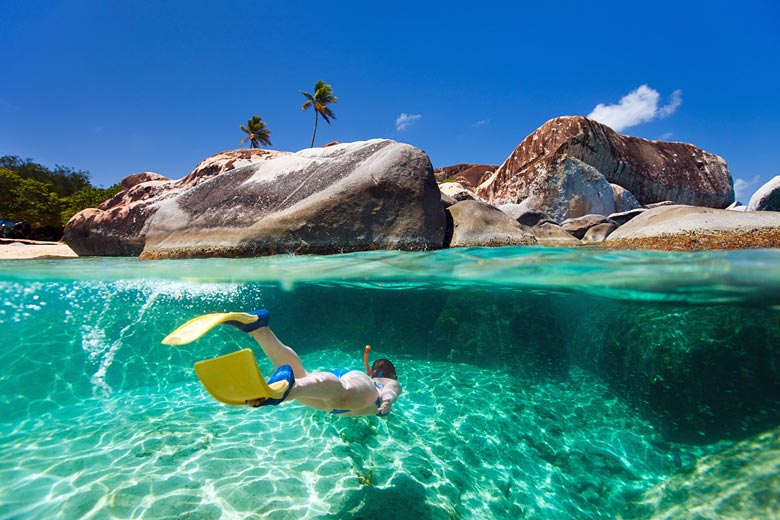
The main island of Tortola is home to 75% of the population while the majority of the other 55 islands and cays are largely uninhabited. The islands have seemingly unlimited brochure-perfect beaches with white sands. The government keeps a close check on the tourist industry to ensure that no area becomes overdeveloped and crowded. As a result there is an abundance of idyllic deserted coastline.
The islands are characterised by secluded bays and coves, making them popular with boating enthusiasts who can hop from one deserted coral cay to the next. The islands' interiors are largely unspoilt with much of the indigenous dense sub-tropical vegetation remaining intact. On the whole the landscape consists of undulating hills, but some areas and a few islands, notably Anegada, are flat.
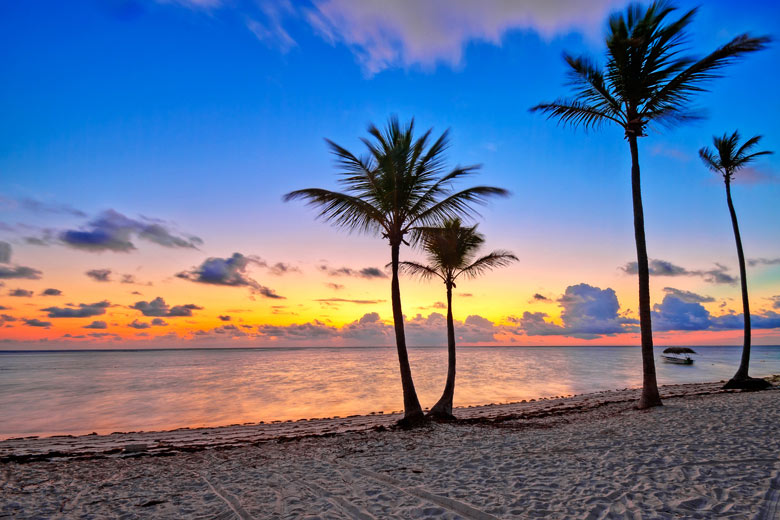
The British Virgin Islands have a tropical climate with warm to hot daytime temperatures throughout the year that vary by only a few degrees from month to month.
Rainfall is mainly concentrated in the months from the end of June to the end of November with a very short 'winter' dry season that runs from February to April. This is also the sunniest time of the year, broken only by a few afternoon clouds and occasional showers. However even during the peak rainy season, from September to November, when rain falls most afternoons, there is still plenty of sunshine.
Like most of the islands in the Northern Caribbean, The British Virgin Islands lie directly in the track of Atlantic hurricanes travelling from the centre of the Atlantic towards Florida and the Gulf of Mexico. The risk of a hurricane striking is greatest from July to October.
British Virgin Islands weather averages
Temperature in British Virgin Islands (°C)
| Jan | Feb | Mar | Apr | May | Jun | Jul | Aug | Sep | Oct | Nov | Dec | |
|---|---|---|---|---|---|---|---|---|---|---|---|---|
| Max temperature (daytime) | 28 |
28 |
28 |
29 |
29 |
30 |
30 |
31 |
31 |
30 |
29 |
28 |
| Min temperature (night-time) |  21 21 |
21 |
21 |
 22 22 |
23 |
 24 24 |
24 |
24 |
24 |
24 |
23 |
22 |
| Heat & Humidity |  M M |
M |
M |
M |
 H H |
H |
H |
H |
H |
H |
H |
M |
| Sea temperature | 26 |
26 |
26 |
26 |
27 |
28 |
28 |
28 |
29 |
29 |
28 |
27 |
Note: 0 = None, L = Low, M = Moderate, H = High, VH = Very high, E = Extreme
Sunshine & UV index in British Virgin Islands
| Jan | Feb | Mar | Apr | May | Jun | Jul | Aug | Sep | Oct | Nov | Dec | |
|---|---|---|---|---|---|---|---|---|---|---|---|---|
| Daily hours of sunshine | ||||||||||||
| Daily hours of daylight |  11 11 |
 12 12 |
12 |
 13 13 |
13 |
13 |
13 |
13 |
12 |
12 |
11 |
11 |
| UV Index (Maximum) |  8 8 |
10 |
 11 11 |
11 |
11 |
11 |
11 |
11 |
11 |
10 |
8 |
 7 7 |
Rainfall in British Virgin Islands
| Jan | Feb | Mar | Apr | May | Jun | Jul | Aug | Sep | Oct | Nov | Dec | |
|---|---|---|---|---|---|---|---|---|---|---|---|---|
| Number of days with some rain | 19 |
15 |
14 |
13 |
16 |
15 |
18 |
20 |
19 |
19 |
20 |
21 |
| Average monthly rainfall (mm) |  68 68 |
 54 54 |
57 |
 88 88 |
 129 129 |
73 |
85 |
124 |
 143 143 |
 161 161 |
161 |
 119 119 |
Tropical storm risk: British Virgin Islands hurricane season
% of month affected by tropical storms
Jan
Feb
Mar
Apr
May
Jun
Jul
Aug
Sep
Oct
Nov
Dec
Compare British Virgin Islands weather with the UK
The weather chart below compares the average monthly maximum daytime temperature for British Virgin Islands (Tortola) and the UK (London).
Maximum daytime temperature (°C)
British Virgin Islands (Tortola)
UK (London)
Jan
Feb
Mar
Apr
May
Jun
Jul
Aug
Sep
Oct
Nov
Dec
Metric (°C / mm) | Imperial (°F / inches)
More about the British Virgin Islands
Be inspired
Get your weekly fix of holiday inspiration from some of the world's best travel writers plus save on your next trip with the latest exclusive offers
We promise not to share your details
Related posts

Popular travel offers


Explore holiday destinations
- Beach holidays
- City breaks
- Family holidays
- Half term holidays
- Spring holidays
- Summer holidays
- Autumn holidays
- Winter sun holidays
- Honeymoons
- Coolcations
- Compare places
- Ski resorts
Save with latest deals & discounts
- Holiday offers
- Top travel brands
- Airlines & flights
- Discount hotels
- TUI
- Jet2holidays
- Neilson
- Marella Cruises
- Holiday Extras
- Pierre & Vacances
- Caledonian Travel
- Club Med
Airport parking
- Manchester Airport
- Stansted Airport
- Bristol Airport
- Luton Airport
- Birmingham Airport
- Edinburgh Airport
- Gatwick Airport
- Glasgow Airport
- Newcastle Airport
Airport lounges
- Manchester Airport
- Birmingham Airport
- Bristol Airport
- Edinburgh Airport
- Glasgow Airport
- Heathrow Airport
- Newcastle Airport
- Stansted Airport
- Gatwick Airport